fastplotlib.ui.ImguiColorbar#
- class ImguiColorbar(graphics, histogram=None, data_range=None, title=None, height=None, bar_width=16, region_drag=True)[source]#
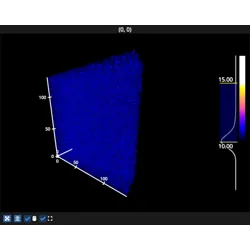
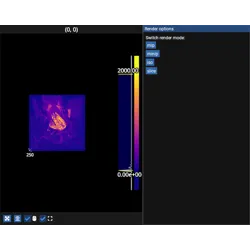
An imgui colorbar with draggable vmin/vmax handles, an optional histogram, a gamma slider, and a right-click colormap picker.
- Parameters:
graphics (ImageGraphic | ImageVolumeGraphic | LineGraphic | ScatterGraphic | list) – the graphic(s) whose colormap and value range this colorbar controls. The bar drives
vminandvmaxof an image, andcmap_rangeof a line or scatter, which must already have acmap.histogram (tuple[np.ndarray, np.ndarray], optional) – a precomputed
(counts, edges)histogram drawn to the left of the bar. It is not recomputed when the graphic’s data changes, set thehistogramproperty to update it.data_range ((min, max), optional) – the value range spanned by the bar. Defaults to the histogram edges if a histogram is provided, otherwise to the data range of the first graphic.
title (str, optional) – title drawn above the bar, no title is drawn if
Noneheight (int, optional) – height of the colorbar in pixels, fills the available vertical space if
Nonebar_width (int) – width of the colored bar in pixels
region_drag (bool) – if
True, dragging between the handles shifts the vmin/vmax window without changing its width