
Note
Go to the end to download the full example code.
ImGUI Colorbar#
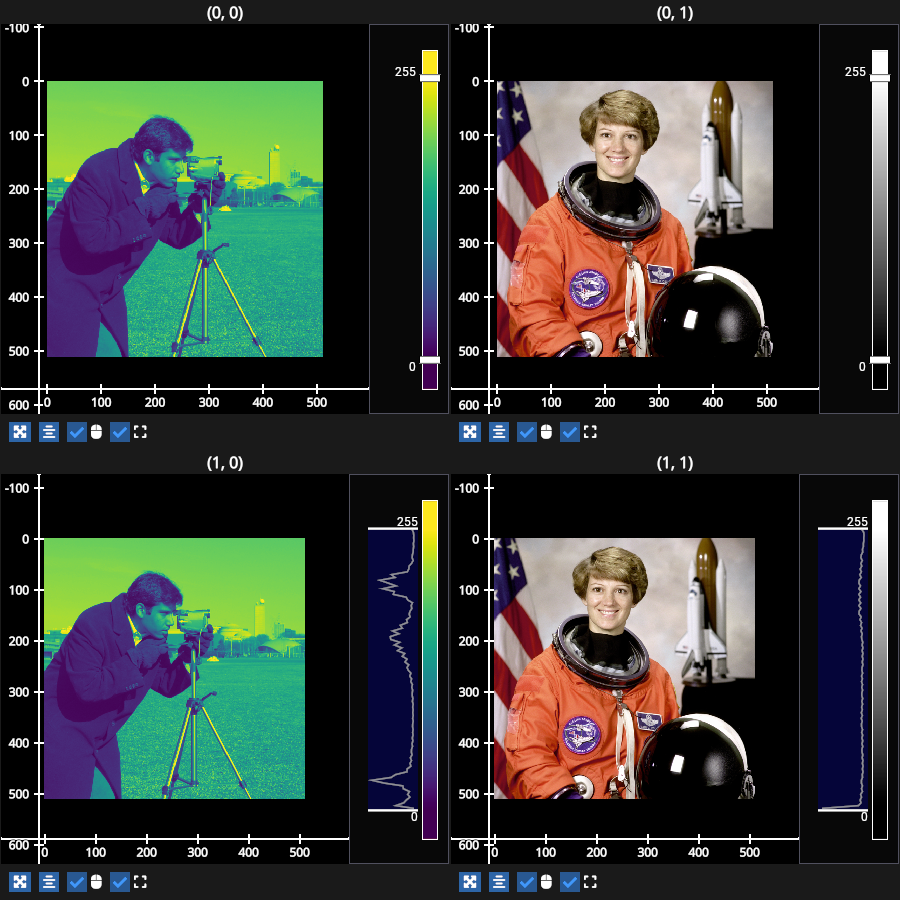
Create an ImguiColorbar manually and add it to the right edge of each subplot.
# test_example = false

import numpy as np
import fastplotlib as fpl
import imageio.v3 as iio
from fastplotlib.ui import ImguiColorbar

# a grayscale image and an RGB image
camera = iio.imread("imageio:camera.png")
astronaut = iio.imread("imageio:astronaut.png")

figure = fpl.Figure(
    shape=(2, 2), size=(900, 900), canvas_kwargs={"max_fps": 999, "vsync": False}
)

# top row: a plain colorbar for each image
# grayscale image displayed with a colormap
camera_image = figure[0, 0].add_image(camera, cmap="viridis", name="camera")
figure[0, 0].add_imgui_window(
    ImguiColorbar(graphics=camera_image), location="right", size=80
)

# RGB image, it has no colormap so its colorbar is drawn with "gray"
astronaut_image = figure[0, 1].add_image(astronaut, name="astronaut")
figure[0, 1].add_imgui_window(
    ImguiColorbar(graphics=astronaut_image), location="right", size=80
)

# bottom row: the same images, but with a precomputed 100-bin histogram on the colorbar
camera_image2 = figure[1, 0].add_image(camera, cmap="viridis", name="camera")
camera_histogram = np.histogram(camera, bins=100)
figure[1, 0].add_imgui_window(
    ImguiColorbar(graphics=camera_image2, histogram=camera_histogram),
    location="right",
    size=100,
)

astronaut_image2 = figure[1, 1].add_image(astronaut, name="astronaut")
astronaut_histogram = np.histogram(astronaut, bins=100)
figure[1, 1].add_imgui_window(
    ImguiColorbar(graphics=astronaut_image2, histogram=astronaut_histogram),
    location="right",
    size=100,
)

figure.show()


# NOTE: fpl.loop.run() should not be used for interactive sessions
# See the "JupyterLab and IPython" section in the user guide
if __name__ == "__main__":
    print(__doc__)
    fpl.loop.run()
Total running time of the script: (0 minutes 0.826 seconds)