
Note
Go to the end to download the full example code.
ImGUI window placement#
You can add imgui windows to the Figure edges, a subplot edge, and as floating or fixed overlays.
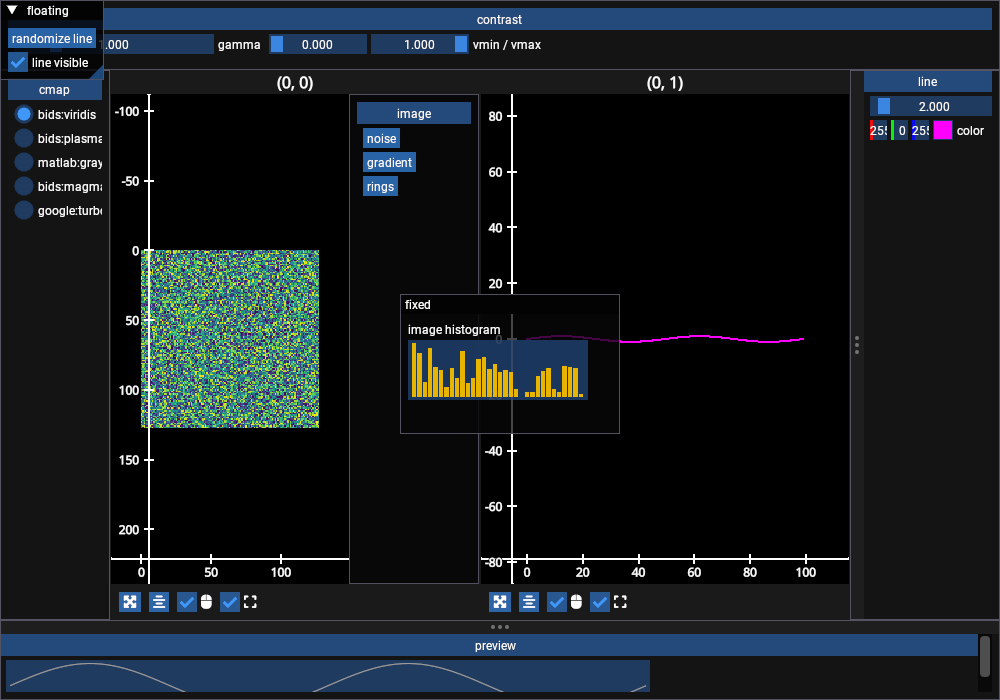
/home/runner/work/fastplotlib/fastplotlib/fastplotlib/graphics/features/_image.py:205: UserWarning: casting float64 array to float32
  warn(f"casting {data.dtype} array to float32")
# test_example = false

import numpy as np
import fastplotlib as fpl
from imgui_bundle import imgui

figure = fpl.Figure(shape=(1, 2), size=(1000, 700))
figure[0, 0].add_image(np.random.rand(128, 128), cmap="viridis", name="image")
figure[0, 1].add_line(np.sin(np.linspace(0, 4 * np.pi, 100)), colors="magenta", name="line")


# left Figure edge: pick the image colormap
@figure.add_imgui_window(location="left", size=110, title="cmap")
def left_gui():
    image = figure[0, 0]["image"]
    for name in ["bids:viridis", "bids:plasma", "matlab:gray", "bids:magma", "google:turbo"]:
        if imgui.radio_button(name, image.cmap.name == name):
            image.cmap = name


# top Figure edge: image contrast, gamma and vmin/vmax sliders side by side
@figure.add_imgui_window(location="top", size=70, title="contrast")
def top_gui():
    image = figure[0, 0]["image"]
    imgui.set_next_item_width(200)
    _, image.gamma = imgui.slider_float("gamma", image.gamma, 0.1, 5.0)
    imgui.same_line()
    imgui.set_next_item_width(200)
    changed, vals = imgui.slider_float2("vmin / vmax", (image.vmin, image.vmax), 0.0, 1.0)
    if changed:
        image.vmin, image.vmax = vals[0], vals[1]


# right Figure edge: line color and thickness
@figure.add_imgui_window(location="right", size=150, title="line")
def right_gui():
    line = figure[0, 1]["line"]
    imgui.set_next_item_width(130)
    _, line.thickness = imgui.slider_float("thickness", line.thickness, 1.0, 20.0)
    changed, color = imgui.color_edit3("color", tuple(float(c) for c in line.colors)[:3])
    if changed:
        line.colors = (*color, 1.0)


# bottom Figure edge: a live preview of the line data
@figure.add_imgui_window(location="bottom", size=80, title="preview")
def bottom_gui():
    ys = np.ascontiguousarray(figure[0, 1]["line"].data[:, 1], dtype=np.float32)
    imgui.plot_lines("##preview", ys, graph_size=imgui.ImVec2(0, 50))


# right edge of the first subplot: regenerate the image
@figure[0, 0].add_imgui_window(location="right", size=130, title="image")
def subplot_gui(subplot):
    if imgui.button("noise"):
        subplot["image"].data = np.random.rand(128, 128)
    if imgui.button("gradient"):
        subplot["image"].data = np.linspace(0, 1, 128)[None].repeat(128, axis=0)
    if imgui.button("rings"):
        xs, ys = np.meshgrid(np.linspace(-6, 6, 128), np.linspace(-6, 6, 128))
        subplot["image"].data = np.sin(np.hypot(xs, ys))


# a floating window, auto-sized and draggable
@figure.add_imgui_window(location="floating", title="floating")
def floating_gui(fig):
    line = fig[0, 1]["line"]
    if imgui.button("randomize line"):
        line.data[:, 1] = np.random.rand(100)
    _, line.visible = imgui.checkbox("line visible", line.visible)


# a window fixed to a fractional extent (xmin, xmax, ymin, ymax) of the canvas
@figure.add_imgui_window(extent=(0.4, 0.62, 0.42, 0.62), title="fixed")
def fixed_gui():
    counts = np.histogram(figure[0, 0]["image"].data.value, bins=32)[0].astype(np.float32)
    imgui.text("image histogram")
    imgui.plot_histogram("##hist", counts, graph_size=imgui.ImVec2(180, 60))


figure.show()


# NOTE: fpl.loop.run() should not be used for interactive sessions
# See the "JupyterLab and IPython" section in the user guide
if __name__ == "__main__":
    print(__doc__)
    fpl.loop.run()
Total running time of the script: (0 minutes 0.291 seconds)