Note
Go to the end to download the full example code.
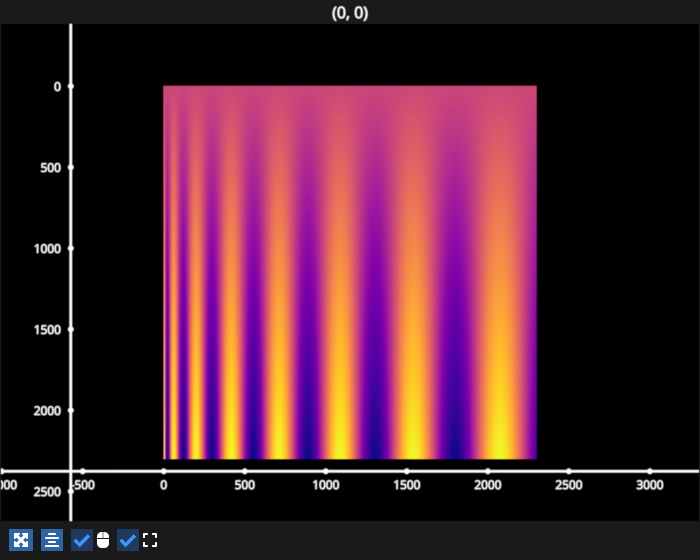
Heatmap or large arrays#
Example showing how ImageGraphics can be useful for viewing large arrays, these can be in the order of 10^4 x 10^4. The performance and limitations will depend on your hardware.
# test_example = true

import fastplotlib as fpl
import numpy as np


figure = fpl.Figure(size=(700, 560))

xs = np.linspace(0, 2300, 2300, dtype=np.float16)

sine = np.sin(np.sqrt(xs))

data = np.vstack([sine * i for i in range(2_300)])

# plot the image data
image = figure[0, 0].add_image(data=data, name="heatmap")
del data

figure.show()

# NOTE: fpl.loop.run() should not be used for interactive sessions
# See the "JupyterLab and IPython" section in the user guide
if __name__ == "__main__":
    print(__doc__)
    fpl.loop.run()
Total running time of the script: (0 minutes 0.543 seconds)