
Note
Go to the end to download the full example code.
ImGUI Colorbar on Lines and Scatters#
A colorbar on a line or a scatter drives its cmap_range, the (min, max) of the
cmap_transform that is mapped onto the colormap. Drag the handles to change which part of the
transform the colormap spans.
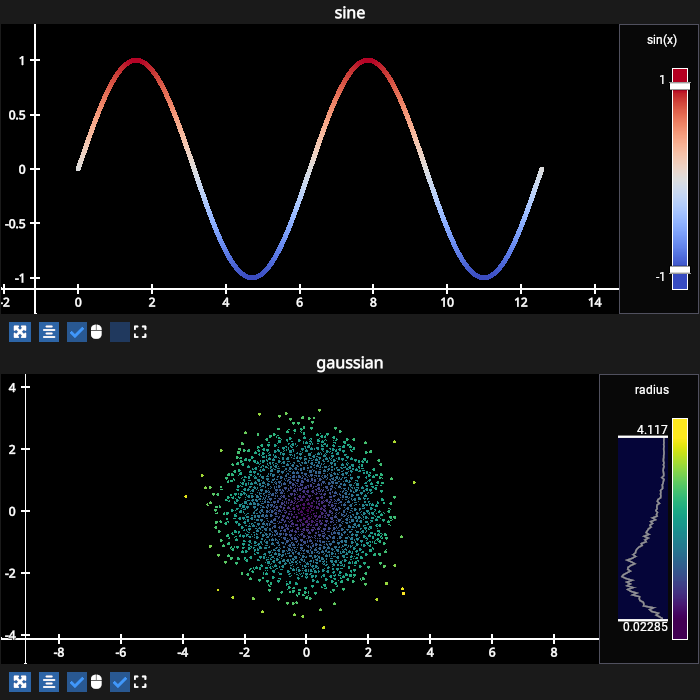
# test_example = true

import numpy as np
import fastplotlib as fpl
from fastplotlib.ui import ImguiColorbar

figure = fpl.Figure(shape=(2, 1), names=[["sine", "gaussian"]], size=(700, 700))

# a sine colored by its own value, with a diverging colormap centered on zero
xs = np.linspace(0, 4 * np.pi, 500, dtype=np.float32)
ys = np.sin(xs)

sine = figure["sine"].add_line(
    np.column_stack([xs, ys]),
    cmap="matplotlib:coolwarm",
    cmap_transform=ys,
    thickness=5,
)
figure["sine"].add_imgui_window(
    ImguiColorbar(graphics=sine, title="sin(x)"), location="right", size=80
)

# a 2d gaussian blob colored by the distance of each point from the origin, with the distribution
# of those distances drawn on the colorbar
rng = np.random.default_rng(0)
points = rng.normal(0, 1, (5_000, 2)).astype(np.float32)
radius = np.linalg.norm(points, axis=1)

blob = figure["gaussian"].add_scatter(
    points,
    cmap="bids:viridis",
    cmap_transform=radius,
    sizes=4,
)

figure["gaussian"].add_imgui_window(
    ImguiColorbar(
        graphics=blob,
        title="radius",
        histogram=np.histogram(radius, bins=100),
    ),
    location="right",
    size=100,
)

figure["sine"].camera.maintain_aspect = False

figure.show()


# NOTE: fpl.loop.run() should not be used for interactive sessions
# See the "JupyterLab and IPython" section in the user guide
if __name__ == "__main__":
    print(__doc__)
    fpl.loop.run()
Total running time of the script: (0 minutes 0.418 seconds)